

 Free Newsletter

Elevated Home Prices And Stagnant Wages Make Home-ownership Unaffordable Across The Country
Staff Report//July 2, 2025//

Elevated Home Prices And Stagnant Wages Make Home-ownership Unaffordable Across The Country
Staff Report//July 2, 2025//


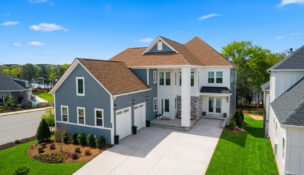
ATTOM has released its latest U.S. Home Affordability Report showing that in 99 percent of counties with sufficient data to analyze median-priced single-family homes and condos were less affordable in the second quarter of 2025 than historical averages. It marks the 14th consecutive quarter where purchasing and maintaining a median-priced home in the U.S. has required a higher percentage of the typical owner’s wages than has historically been necessary.
ATTOM’s analysis shows that major expenses for a median-priced home in the U.S. would have consumed 33.7 percent of the average American’s annual income. That was up from 32 percent in the first quarter of the year, and well above the 28 percent share typically recommended by lenders.
The affordability report highlights the challenges facing current homeowners and prospective buyers as home prices continue to rise. After a brief dip from $355,000 in the fourth quarter of 2024 to $350,275 in the first quarter of 2025, the median home price in the U.S. increased to $369,000 in the second quarter of the year. Meanwhile, the average 30-year fixed mortgage rate sat at 6.82 percent.
“The squeeze is really on for would-be buyers as we go into the summer, which is usually when the housing market is most active,” said Rob Barber, CEO of ATTOM. “Prices just continue to rise and there’s been no relief on mortgage rates. Meanwhile, typical wages are barely increasing from quarter-to-quarter.”
Since the first quarter of 2020, the median cost to purchase a home in the U.S. has gone up 55.7 percent. The average wage in the U.S, meanwhile, has only risen by 26.6 percent. (The most recent wage data available from the U.S. Bureau for Labor Statistics is for the fourth quarter of 2024).
ATTOM determines affordability for average wage earners by calculating the amount of income needed to meet major monthly home ownership expenses—including mortgage payments, mortgage insurance, property taxes and homeowner’s insurance—on a median-priced single-family home and condo, assuming a 20 percent down payment and a 28 percent maximum “front-end” debt-to-income ratio. That required income is measured against annualized average weekly wage data from the BLS (see full methodology below).
Compared to historical averages, owning a median-priced home in the second quarter of 2025 was less affordable in 99.3 percent (575) of 579 counties with sufficient data to analyze. That was up slightly from the previous quarter, when home ownership was less affordable in 96.9 percent of counties than had historically been the case.
In 77.9 percent (451) of the 579 counties, home expenses during the second quarter of the year exceeded 28 percent of the typical resident’s wages, making home ownership unaffordable by standard guidelines. That included some of the nation’s most populous counties, such as Los Angeles County, CA; Cook County, IL (Chicago); Maricopa County, AZ (Phoenix); San Diego County, CA; and Orange County, CA (outside Los Angeles).
The most populous counties where major home expenses accounted for less than 28 percent of the typical resident’s wages were Harris County, TX (Houston); Wayne County, MI (Detroit); Philadelphia County, PA; Cuyahoga County, OH (Cleveland); and Allegheny County, PA (Pittsburgh).
Related Articles
Related Content


Latest News
- Beechwood’s Lakeside Pointe near Charlotte named community of the year
- ATTOM Analysis Finds Spring Remains The Prime Window For Home Sellers
- The Carson Debuts in Charlotte’s West Morehead Corridor, Introducing a New Era of Connected Living
- Wellness Concepts PVOLVE and OM Spa Now Open at Seventeen Hundred on East, Expanding Charlotte’s First Wellness-Focused Residential Community
- Moving Stress Statistics & How Homebuyers Can Avoid Costly Surprises
- Foreclosure activity rises nationwide with Florida and South Carolina among hardest hit states
- The McMansion era is over: How American homes have changed in 20 years
- Construction Jobs Increase In 30 States And D.C. Between February 2025 And February 2026
- Construction jobs rise in 38 states including North Carolina and Texas
- ATTOM reports home flipping profits lowest since great recession
- Carolina commercial leads $18 million revitalization of biggs park mall in Lumberton
- Lucern Capital Partners Completes $12.3 Million Sale of Fully Leased Crosslake Park
Features
- City of Charlotte Introduces New Deputy City Manager and New Director of Housing & Neighborhood Services
- JLL strengthens Charlotte capabilities with top Agency Leasing team hire from Foundry Commercial
- Thomas & Hutton Grows Charlotte Team With Two New Team Members
- Nick Schirato Joins Thomas & Hutton As An Environmental Designer In Charlotte
- Foundry Taps Alex Olofson to Lead Capital Markets Growth in Charlotte
- Tony Lathrop Strengthens Parker Poe’s Infrastructure, Transportation & Public Policy Services
- MVA Expands Economic Development & Incentives Group, Appoints Beth Buckner as Head
- Thomas & Hutton Announces Kaylee Neal’s Professional Engineer Licensure In North Carolina
- Thomas & Hutton Announces Sixth-Generation Leadership Transition as Firm Enters 80th Year
- Movement Mortgage welcomes Justin Caplan as East Coast Growth Director
- Ki McCaskill Joins Thomas & Hutton As Survey Technician In Charlotte
- Brittany Bowens Joins Weichert, Realtors® – LKN Partners